

Frames That Go Viral: An Analysis of How the Framing of the Israel-Palestine Conflict Affects its Performance on TikTok
Abstract
The Israel-Palestine conflict, while spanning more than seven decades, entered a distinct escalation in 2023. Unlike conflicts from preceding decades, the 2023 Gaza War has remarkably different conditions due to the advent of the social media landscape, which drastically alters how narratives are constructed, disseminated, and consumed by global audiences. Social media wields considerable influence on the understanding and reception of geopolitical conflicts in today’s world. As such, understanding the workings of social media virality is crucial in the construction of public narratives and opinions in times of conflict. The hypotheses are that Humanitarian Framing videos are the most effective and influential, and Emotional Intensity of a post correlates positively with its influence. Categorisation of the frame packages was used with reference to the relevant framing theory frameworks. Zeeschuimer was used for data collection of the Tiktok posts. Z-score normalisation was used to normalise the influence metric. VADER Python library was used for sentiment analysis of the comments. Google Sheets API was used to allow Python to access the Google Sheets data. RStudio was used for the linear regression analysis and the data visualization was done using the ggplot2 library. Humanitarian Framing was found to increase influence score the most consistently. Emotional Intensity metric used in this paper is not a reliable predictor of influence.
Introduction
The Israel-Palestine conflict–one of the most enduring and contested geopolitical struggles of the modern era–has been increasingly prominent in the realm of digital discourse. Contemporary tensions originated in the ashes of the 1948 Arab-Israeli War, which resulted in the large-scale displacement of the Palestinian Arabs from the lands which constituted the newly formed state of Israel.1 This foundational event–termed the “War of Independence” in Israeli historiography and the “Nakba” (“catastrophe”) by many Palestinians, established the conflict’s foundational narratives.2
For Jewish Zionist leaders, statehood represented both a response to widespread antisemitism in Europe, especially manifested in the Holocaust’s systematic killing of 6 million Jews during the Second World War,3 and the realisation national self-determination in their historic homeland.4 Hence, the state of Israel was viewed as necessary for the survival and preservation of the Jewish people and their culture.5
Conversely, Palestinian Arabs experienced the war as a traumatic dispossession, leading to widespread resentment against Israel. Approximately 750,000 Palestinians Arabs were displaced from their ancestral villages and lands–many facing violence from Jewish paramilitary forces.1 The movement for the establishment of a Palestinian state was consequently framed as imperative to protect the Palestinian people against any further violence and dispossession by Israeli forces, as well as securing self-determination.6
Subsequent conflicts and political developments such as the Six-Day War in 1967, which resulted in the Israeli occupation of the West Bank, Gaza, and East Jerusalem;7 the Yom Kippur War in 1973; the First Intifada (1987-1993); and the Oslo Accords (1993) further muddled the modern territorial and political landscape.8 The collapse of the Oslo framework, continued Israeli settlement expansion in the Palestinian Territories, and cycles of violence have sustained what Gelvin terms an “intractable conflict” into the twenty-first century.9 Despite decades of strife, these divergent historical narratives and collective memories continue to shape current Israeli and Palestinian political identities, beliefs and sentiments.2
Nevertheless, the core idea and narratives justifying both the existence of an Israeli and Palestinian state remain remarkably persistent. These discourses are now propagating in a new battleground, the digital realm. The 7 October 2023 attacks marked the sudden, catastrophic escalation of this conflict. Cross-border raids carried out by Hamas militants killed approximately 1200 Israelis, with the abduction of about 240 others.10 This marked the deadliest day for Jews since the Holocaust, and the single largest mass casualty incident in Israel’s history, constituting what the Israeli government called “our 9/11”.11 This attack once again evoked the horrors of the Holocaust, which served to bolster the idea–that Jewish survival hinges upon the existence of the state of Israel.12
In response, the Israeli government embarked on an invasion into the Gaza strip–termed Operation Iron Swords–with the aim of completely wiping out Hamas.13 However, this too resulted in an unprecedented scale of military action by the Israel Defence Forces (IDF). The invasion marked the start of the most intense aerial bombardment and largest ground invasion by the IDF in Gaza’s history–surpassing all previous wars in the amount of destruction caused.14 As of December 2025, there are about 70,000 confirmed Palestinians killed in Gaza, the majority being non-combatants. This figure dwarfs the death tolls of all previous wars in Gaza combined.15 The result of the vast destruction of civilian infrastructure left many Palestinians in Gaza without adequate food, water, and medicine; as well as being displaced from their homes.16 For Palestinians, this devastation has evoked what some scholars call “the ongoing Nakba” — a continuing process of displacement and dispossession that reinforces demands for the need for Palestinian statehood–a sentiment echoed by many Palestinians.2
The 2023 Gaza war, albeit not the first, is arguably the most significant. What sets the 2023 Gaza War apart from past conflicts other than its scale, is also the advent of a multitude of social media platforms. Social media platforms have transformed from mere channels of information exchange into central battlegrounds for narrative contestation and influence operations.17 These spaces attract individual users and the media, driven by all types of beliefs, biases and backgrounds, tend to flock to these platforms to compete in propagating their rhetoric.18 Among such platforms, TikTok has emerged as a particularly significant site, distinguished by its algorithm-driven content virality and its popularity among younger demographics.19
The way conflict-related content is constructed and disseminated on the platform has the power to shape perceptions, mobilise activism, and polarise public opinion on a global scale.20 For many users in the current generation, social media platforms serve as a primary, if not sole, gateway to grasping current affairs–like the Israel-Palestine conflict.21 The way content regarding the war is framed on TikTok–through curated imagery, audio, and text–greatly influences people’s perceptions and hence emotional responses, political allegiances, and collective understanding surrounding the conflict.22 Hence, social media holds the power to shape the trajectory of the war by shifting public sentiments and placing pressure on governments to take action through protests and other forms of political engagement.23
To analyse how framing in a video shapes its given message and influences users, this study draws upon framing theory, particularly Gamson and Modigliani’s concept of ‘interpretive packages’.They argue that rather than operating as simple containers of information, media content functions as coherent meaning systems that provide a central organising idea that gives meaning to an unfolding strip of events.24 We apply this approach, which was developed before the creation of social media, to TikTok. We argue that videos operate as such ‘frame packages’–integrating core frames with supporting symbolic, narrative, and emotional elements that collectively construct social reality and guide the audience to an interpretation and conceptualisation of issues like the Israel-Palestine conflict.25
This approach allows for the systematic classification of TikTok videos into coherent meaning systems based on their framing strategies. The research aims to analyse whether specific framing packages impact how influential videos relating to the Israel-Palestine conflict is on TikTok, through examining video engagement and sentiment analysis.
Therefore, our hypothesis is as follows:
Hypothesis 1 — Humanitarian Package videos are the most effective and influential.
Hypothesis 2 — Emotional intensity of a post correlates positively with its influence.
This study contributes to the field of sociology by bridging the gap between social media and societies, by revealing the degrees to which such platforms are actively shaping how people engage and perceive conflict; specifically by providing an empirical analysis of how the ways things are framed influence people’s perception. Our study could also be used to replicate the analysis cross-platform to see if framing-emotional-influence relationship is platform-dependent or generalisable. Additionally, the paper could be used for policy oriented research on manipulative framing, emotional escalation and misinformation, especially relevant to vulnerable and marginalised communities.
Materials and methods
We began with the data collection required for the study. After creating the data set, we categorised the data into different framing categories. We then analysed the data to find out which framing category was the most influential, and which was most emotionally evocative. To do so, we utilised content analysis, both quantitative and qualitative.
Data Collection
We used Zeeschuimer — a browser extension on GitHub–to collect social media data on TikTok. We collected data of the likes, shares, views and comments of the video. For comment collection, we did not scroll through comment threads; Zeeschuimer was used to capture only surface-level comments rather than the full comment set. We collected engagement metrics from 15 videos for each 30 hashtags. 5 hashtags were later deemed unusable due to most videos not being related to the Israel-Palestine conflict. Once completed, we collected 161 posts from TikTok’s For You Page.
Categorisation
The categorisation of the data was done manually. We first identified six different frame packages: Humanitarian, Political/Activist, News, Storytelling/Historical/Analysis, Satirical/Meme, and Military. Each package was identified through its integrated use of core frames, condensing symbols, and emotional appeals with reference to the theoretical framework posited by Gamson & Modigliani.24 Videos unrelated to the conflict, or that were deleted, were filtered out of the data set. The selection criteria used to categorise the data are detailed in the below sections.
After using Zeeschuimer to collect and categorise the videos, we extracted engagement metrics for each video: number of likes, number of comments, number of shares, and number of views. These metrics are on different numerical scales, so direct comparison would distort any combined measure of performance.
Humanitarian Package
The Humanitarian Package employs a ‘human tragedy’ core frame, utilising somber music, imagery of destroyed homes and infrastructure, and imagery of crying children and injured civilians as primary positioning devices. Its condensing symbols include hashtags such as #HumanitarianCrisis, #Gaza, and #CeasefireNow, which distils complex suffering into shareable digital markers.
This category represents one of the more emotionally direct forms of content. Its primary purpose is to garner attention and evoke sympathy for civilian victims of the conflict, achieved through explicit visual documentation of physical injury, death, displacement, starvation, and infrastructural devastation. Audio elements — including anguished cries, explosions, and mournful music — further amplify affective resonance. Notably, this package is distinguished by its explicit calls to action, frequently urging viewers to donate or raise awareness regarding civilian suffering. Examples include United Nations appeals for humanitarian aid to Gaza, which combine graphic evidence of deprivation with direct solicitations for assistance, positioning emotional appeal as a mechanism for tangible material support.
Political/Activist Package
The Political/Activist Package centers on a ‘struggle for Israel/Palestine’ core frame — utilising national flags, protest chants, and partisan slogans as positioning devices. Its condensing symbols include rally footage, protest footage, and ideologically marked hashtags such as #FreePalestine or #StandWithIsrael.
This category is distinguished by its explicit partiality rather than neutrality. While content may overlap with Humanitarian, News, or Historical packages in form, its defining feature is overt bias — whether in support of Palestinian resistance or Israeli self-determination — often framed through moral binaries. Unlike Humanitarian packages that foreground innocent suffering, or News packages that prioritise factual reporting, Political/Activist content emphasises emotional persuasion and ideological allegiance. Hashtags and visual rhetoric are deployed not merely for visibility, but to signal communal identity and galvanise viewers toward political action, frequently prioritising affective resonance over balanced evidentiary presentation. Thus, the main determining criteria for a video to be classified under the Political/Activist Package is a clear political bias in favour of one side, regardless of the video’s genre.
News Package
The News Package, centered on a ‘breaking news’ frame, utilises formal narration, headlines, logos, statistics, and serious music to establish authority and credibility, while on-the-ground footage often serves as its primary condensing symbol for immediacy and shareability. On TikTok, news content reporting on the Israel-Gaza war —often originates from established outlets with professional editing and well-grounded facts. However, such content frequently also overlaps with Humanitarian frames when emphasising civilian suffering, or Political frames when exhibiting narrative bias, demonstrating the fluid boundaries between purportedly neutral reporting and perspectival framing in conflict coverage. For this reason, many videos while seemingly reportorial in nature–fell under the aforementioned, more partisan frame packages, especially given the conflict’s sensitive nature.
Analysis/Historical/Storytelling Package
The Analysis/Historical/Storytelling Package employs a core frame of emphasising the conflict’s historical complexity and contextual depth. Positioning devices often include formal or text-to-speech narration, cartographic visuals depicting territorial changes, chronological timelines, and analytical commentary. Condensing symbols consist of archival photographs and key historical imagery, such as images and documentation of population displacement during the 1948 Nakba.
This category encompasses content primarily focused on historical narrative, causal explanation, or analytical breakdown of the conflict. The central criterion is an explanatory focus on past events, regional history, or geopolitical analysis–frequently utilising cartography to illustrate shifting borders and territorial control over time. Archival imagery serves as evidence, connecting historical claims to visual documentation. Production styles vary from professional narration by established news or educational channels to AI-generated videos from individual creators.
A key analytical challenge within this package is the inherent difficulty of maintaining neutrality. While ostensibly factual in presentation, the selection of historical events, framing of causality, and interpretation of maps often introduces narrative bias, subtly favoring either Israeli or Palestinian historical narratives. Hence, videos are classified within this category based on their explanatory focus and use of historical/analytical devices, even when such explanations carry implicit perspectival framing
Satirical/Meme Package
The Satirical/Meme Package employs a core frame that positions the conflict and its accompanying politics as absurd, hypocritical, or tragically hopeless. Its positioning devices include dark humor, performative skits, satirical animations, and ironic textual commentary. Condensing symbols frequently include trending audio tracks, established meme formats, and hyperbolic visual edits to package critique within the digital humour. This often manifests in a diverse range of content unified by its use of mockery, irony, and ridicule as primary rhetorical modes. Generally, most videos under this package display partiality towards one side while mocking the other.
Military Package
The Military Package conceptualises the conflict primarily as a strategic and tactical struggle between armed forces. Its positioning devices include cartographic visuals denoting troop movements and territorial control, heroic or anecdotes of military personnel, an authoritative narrative tone, specialised military terminology, and often dramatic music as an accompaniment. Condensing symbols for this package frequently involve hashtags such as #IDF or #PalestinianResistance. Criteria for this package includes analytical breakdowns of military strategy and operations, first-person combat footage, and propaganda-oriented content designed to showcase military prowess and success.
Analysis of Data
Obtaining a numeric metric of influence by averaging Z-scores
To enable fair comparison across metrics, we apply Z-score normalisation. Z-score normalisation standardises each metric relative to the overall dataset, ensuring that no single metric dominates the influence measure due to scale differences. This allows meaningful patterns and relative performance to be identified across videos.
Z-score normalisation (applied to each engagement metric of each post): where:
- is the Z-score for the respective datasets: likes, comments, shares, views
- is the value of the data point.
- is the mean of the dataset across all data sets, not specific to the category.
- is the standard deviation across all data sets, not specific to the category.
Influence score of each singular post: where:
- , , , are the Z-scores for likes, comments, shares, and views respectively.
- is the average standardised engagement of a single video
Obtaining a numeric metric of emotional intensity using VADER
First, a Google Sheets API was set up to allow Python to access the dataset stored in the Google Sheets. Next, the VADER (Valence Aware Dictionary and Entiment Reasoner) library was used for sentiment analysis. Comments were extracted from the Google Sheet and processed using VADER, which generates sentiment scores. The compound score, which ranges from -1 to 1, was used as it captures the overall emotional polarity of the text. Emotional intensity was operationalised as the magnitude of this compound score. For each video, the compound sentiment scores of all associated comments were averaged to represent emotional intensity. The absolute value was used because emotional intensity includes both positive and negative emotions, and the magnitude reflects the strength of emotion regardless of direction.
A linear regression analysis was then conducted using RStudio using the ggplot2 library for visualisation. Due to insufficient data points, videos categorised under the Military and Satirical packages were excluded. The regression was performed only for the News, Political/Activist, Humanitarian, and Analysis/Historical/Storytelling packages. In the regression model, the dependent variable is the influence score, while the independent variable is emotional intensity, represented by the absolute value of the average VADER compound score. (See Additional Information)
A second linear regression analysis was also performed with the mean influence score across the categories as the dependent variable. Analysis was set as the reference category, and emotional intensity was included as a control variable (covariate) as the controlled variable. A box and whiskers plot was generated for visualisation of the data using RStudios using the ggplot2 library. Analysis is used as the reference category as it functions as a neutral baseline for comparison with the other categories. With lower inherent persuasiveness or emotional intent in Analysis posts, there are fewer external factors influencing the regression, allowing category effects to be interpreted more clearly.
Results
The linear regression data (Figure 1) and the box and whiskers plot (figure 2) address hypothesis 1 — Humanitarian Package videos are the most effective and influential. The number of posts we collected from Zeeschuimer, which could be used for the linear regression, is 271. As for the second hypothesis, results are found in Additional Information (Figure 3 to 10). The metric of emotional intensity used in this paper is found to be an unreliable predictor of the variance of influence score.
lm(formula = `Influence Score` ~ `Avg Compound` + Category, data = data)

Residuals:
   Min     1Q    Median   3Q    Max
-0.7258 -0.3197 -0.1763 0.0212 8.5492

Coefficients:
            Estimate Std. Error t value Pr(>|t|)
(Intercept) -0.28006 0.22478 -1.246 0.2139
`Avg Compound` 0.12401 0.30663 0.404 0.6862
CategoryHumanitarian 0.49444 0.23537 2.101 0.0366
CategoryMilitary -0.17127 0.47629 -0.360 0.7194
CategoryNews 0.43119 0.25704 1.678 0.0946
CategoryPolitical 0.05030 0.22938 0.219 0.8266
CategorySatirical -0.07429 0.43377 -0.171 0.8641
Signif. codes:
0 ‘***’ 0.001 ‘**’ 0.01 ‘*’ 0.05 ‘.’ 0.1 ‘ ’ 1

Residual standard error: 0.8389 on 270 degrees of freedom
Multiple R-squared: 0.06438, Adjusted R-squared: 0.04359
F-statistic: 3.097 on 6 and 270 DF, p-value: 0.005987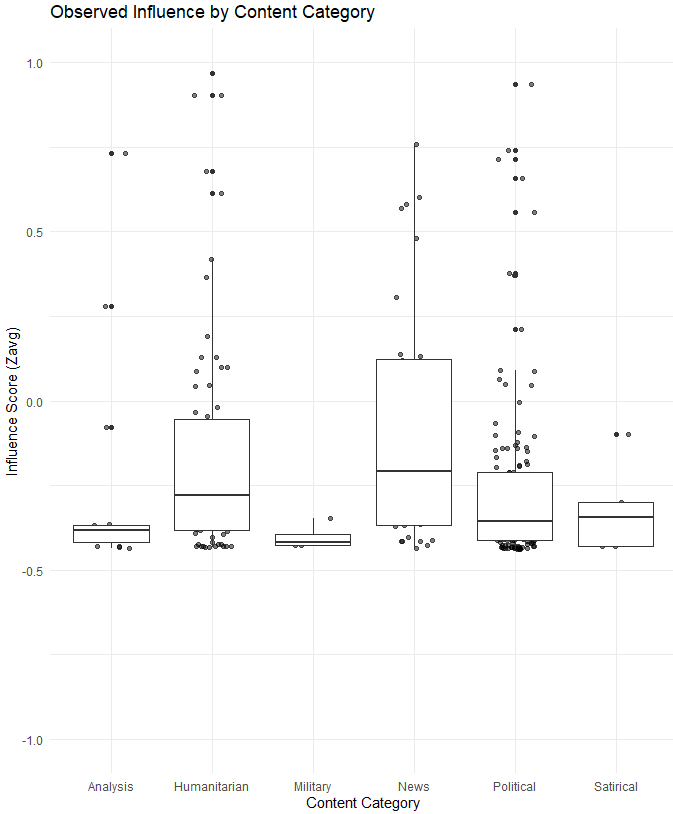
After controlling the emotional intensity, content category explains a small (: 0.04359) but statistically significant ( = 0.00599) variance in influence score. Emotional intensity is not a significant predictor.
Influence scores largely overlap across categories in the box and whispers plot, indicating high variability within category and weak category level effects. Only humanitarian context shows a statistically reliable increase in influence score relative to analysis reference category, as seen in the coefficient (CategoryHumanitarian coefficient = 0.49444). News content shows a weaker, positive pattern while Military, Political and Satirical content do not differ meaningfully from Analysis.
Hence, emotional intensity is a weak predictor of influence score for humanitarian videos quantitatively. Yet, qualitatively, Humanitarian content is considered highly engaging because the videos often depict emotionally evocative scenes due to the nature of these types of videos. We observed that the videos’ condensing symbols frequently include destroyed infrastructure, children suffering and tragic scenes with the intent to garner sympathy eliciting immediate empathy for the afflicted. The contradiction arises because statistical measures of emotional intensity (Avg Compound) may not fully capture complex emotional cues and visual symbolism that drive the viewer engagement, as it is only from comments. The sentiment analysis from the comments are useful in explaining emotional intensity, but insufficient. Consequently, while Humanitarian videos perform better than Analysis in influence score, this effect is more accurately captured by category rather than measured emotional intensity. The impact of the content category would be more precisely assessed by controlling for other variables, such as visual impact, which was not included in this experiment.
Discussion
There are several limitations to this experiment. Firstly, VADER uses a dictionary–based method for sentiment analysis and thus cannot capture certain words or pieces of slang used in different contexts, hence influencing the validity of the emotional intensity score. Additionally, the metric for influence may not completely encompass influence, as influence may propagate beyond quantitative metrics, such as through culture, mindset and language, which are difficult to measure. Additionally, categorisation may be difficult to ascertain in certain TikTok videos. When categorising the data, we faced difficulties assorting the video into categories such as News, Political, and Humanitarian, as the boundary between what constitutes as partial and neutral had to be subjectively decided.
In Additional Information Figure 10, the linear regression of emotional intensity against influence score within the Humanitarian category has a very low , indicating that emotional intensity explains little of the variance in influence score. In contrast, the regression including all categories with Analysis as the reference shows a higher . This is because controlling for emotional intensity isolates the effect of category, allowing differences between categories — such as Humanitarian versus Analysis — to account for additional variance in influence score.
Conclusion
Category level framing has limited influence on a post’s performance compared to other factors, like individual post characteristics. Only Humanitarian framing consistently increases influence score while most other frames do not differ meaningfully from the reference (Analysis). Hence, the research question is partially supported. Some frames (Humanitarian) matter, but overall framing explains little variability in influence. This suggests that variability within each framing category is high, so other factors may better determine TikTok performance. Additionally, the emotional intensity metric used in this paper is found to not be a reliable predictor of influence as seen in the low values in Additional Information (Figures 3 – 10).
Acknowledgements and Declarations
We would like to express our sincerest gratitude towards our mentors, Associate Professor Luke O’Sullivan and Ms Mali Chan, from the National University of Singapore for their invaluable guidance, insightful feedback and continuous support and encouragement throughout our research journey.
The authors would like to specially thank our H1 General Paper teacher, Mr Elmer Loh from Eunoia Junior College, Singapore for encouraging us and guiding our ideation process throughout this journey.
The authors declare that there are no conflicts of interest.
Additional Information
The linear regression of influence score against the Emotional Intensity for the following categories are presented below. These were not statistically significant enough to be included in the paper. This addresses Hypothesis 2 — Emotional Intensity of a post correlates positively with its influence.
Call:
lm(formula = `Influence Score` ~ `Avg Compound`, data = data)

Residuals:
   Min     1Q    Median   3Q    Max
-0.8962 -0.4125 -0.2581 0.2445 2.4089

Coefficients:
            Estimate Std. Error t value Pr(>|t|)
(Intercept) -0.1249 0.1812 -0.689 0.4951
`Avg Compound` 1.8657 0.8657 2.155 0.0381 *
---
Signif. codes:
0 ‘***’ 0.001 ‘**’ 0.01 ‘*’ 0.05 ‘.’ 0.1 ‘ ’ 1

Residual standard error: 0.7197 on 35 degrees of freedom
Multiple R-squared: 0.1172, Adjusted R-squared: 0.09194
F-statistic: 4.645 on 1 and 35 DF, p-value: 0.0381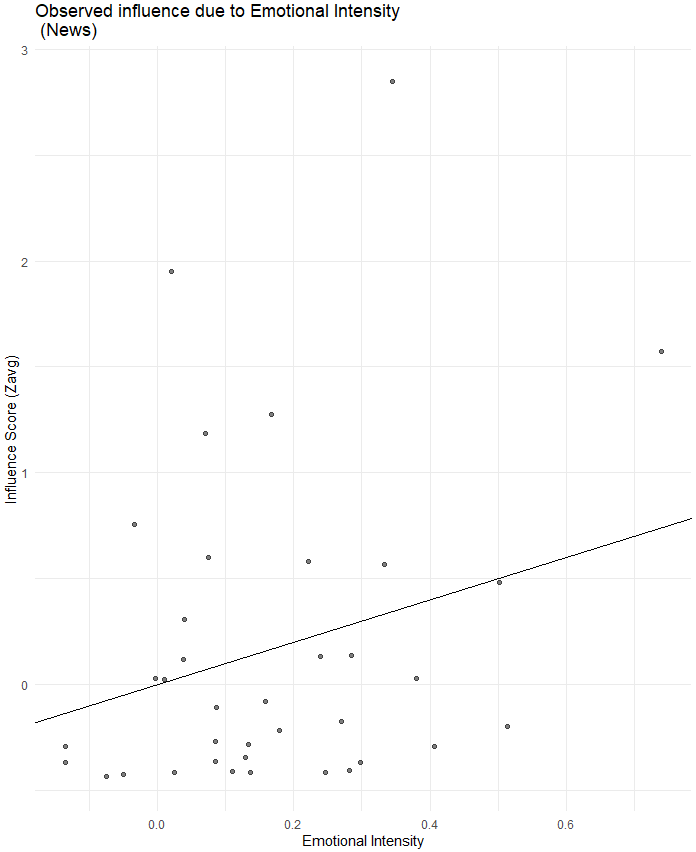
Call:
lm(formula = `Influence Score` ~ `Avg Compound`, data = data)

Residuals:
    Min      1Q     Median    3Q     Max
-0.30016 -0.21272 -0.16222 0.01742 2.90141

Coefficients:
            Estimate Std. Error t value Pr(>|t|)
(Intercept) -0.2235 0.0716 -3.122 0.00221 **
`Avg Compound` 0.1001 0.2266 0.442 0.65939

Signif. codes:
0 ‘***’ 0.001 ‘**’ 0.01 ‘*’ 0.05 ‘.’ 0.1 ‘ ’ 1

Residual standard error: 0.4629 on 131 degrees of freedom
Multiple R-squared: 0.001488, Adjusted R-squared: -0.006135
F-statistic: 0.1952 on 1 and 131 DF, p-value: 0.6594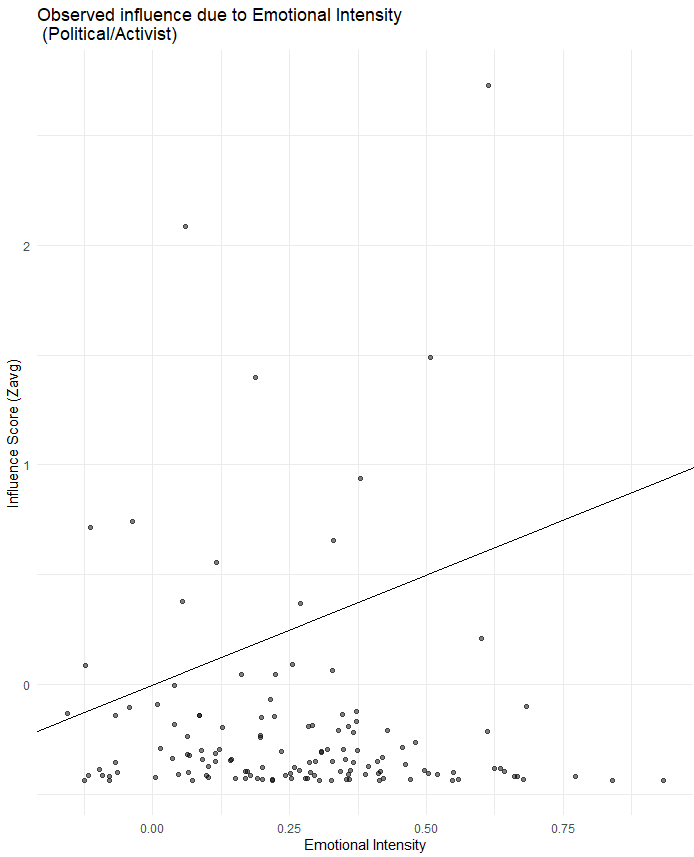
Call:
lm(formula = `Influence Score` ~ `Avg Compound`, data = data)

Residuals:
   Min      1Q      Median    3Q      Max
-0.20458 -0.14334 -0.12246 -0.09773 0.99116

Coefficients:
            Estimate Std. Error t value Pr(>|t|)
(Intercept) -0.2814 0.1305 -2.157 0.0503 .
`Avg Compound` 0.1308 0.4889 0.268 0.7932
---
Signif. codes:
0 ‘***’ 0.001 ‘**’ 0.01 ‘*’ 0.05 ‘.’ 0.1 ‘ ’ 1

Residual standard error: 0.3432 on 13 degrees of freedom
Multiple R-squared: 0.005477, Adjusted R-squared: -0.07102
F-statistic: 0.0716 on 1 and 13 DF, p-value: 0.7932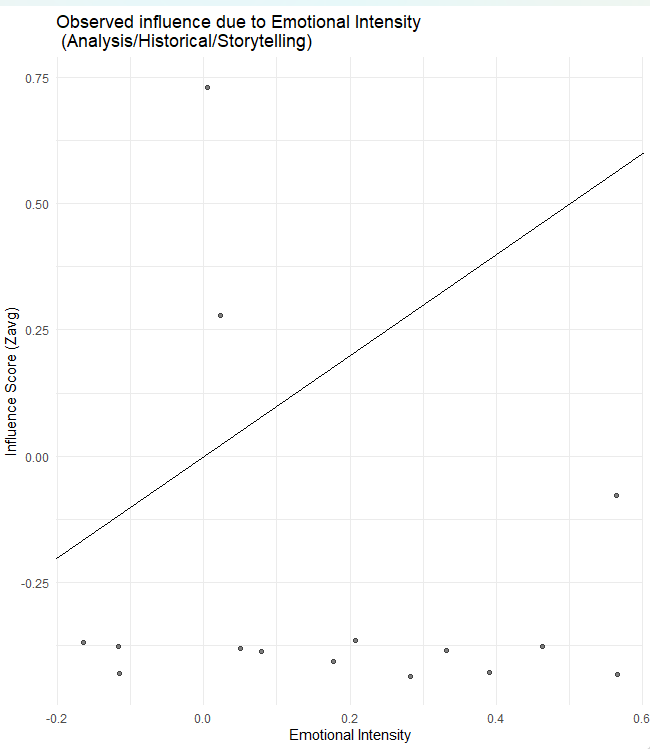
Call:
lm(formula = `Influence Score` ~ `Avg Compound`, data = data)

Residuals:
   Min     1Q    Median    3Q    Max
-0.7448 -0.6045 -0.4585 -0.0835 8.6082

Coefficients:
            Estimate Std. Error t value Pr(>|t|)
(Intercept) 0.3211 0.2314 1.388 0.169
`Avg Compound` -0.4114 0.9084 -0.453 0.652

Residual standard error: 1.312 on 81 degrees of freedom
Multiple R-squared: 0.002525, Adjusted R-squared: -0.009789
F-statistic: 0.2051 on 1 and 81 DF, p-value: 0.6519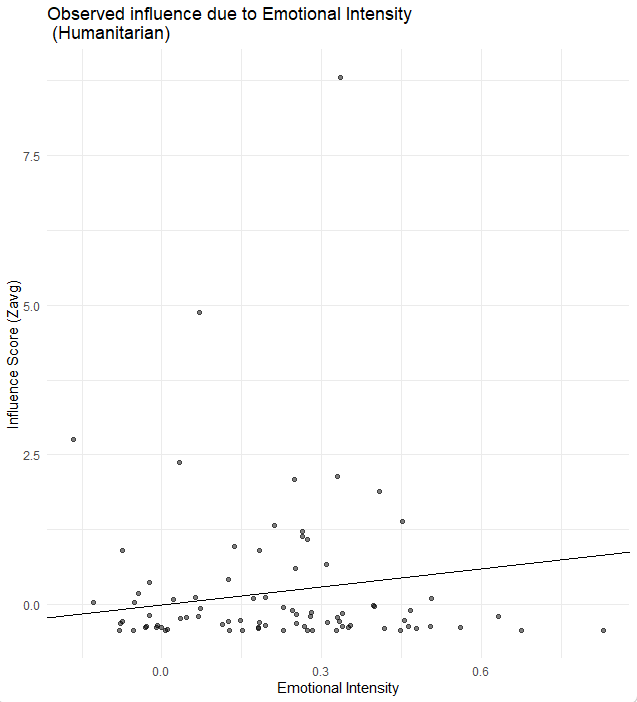
Overall, News shows statistically reliable positive relationships between emotional intensity and influence score. The other categories have low values, indicating emotional intensity explained little variance in influence score.
Code Used
# Use full dataset
data <-
Master_Document_Comments_Political_Activist_CSV_FILE_READY_Tiktok_Comment

#making all values in Avg Compound absolute value
data$`Avg Compound` <- abs(data$`Avg Compound`)

# Run regression
model <- lm(`Influence Score` ~ `Avg Compound`, data = data)

# View results
summary(model)

#predicted influence per category
library(ggplot2)
ggplot(data, aes(x = `Avg Compound`, y = `Influence Score`)) +
  geom_jitter(width = 0.2, alpha = 0.5) +
  geom_abline(method = "lm") +
  labs(
    title = "Observed influence due to Emotional Intensity \n (Political/Activist)",
    x = "Emotional Intensity",
    y = "Influence Score (Zavg)"
  ) +
  theme_minimal()

Code with Emotional intensity as controlled variable: # Use full dataset
data <- Master_Document_Comments_Collated_Tiktok_Comments

#making all values in Avg Compound absolute value
data$`Avg Compound` <- abs(data$`Avg Compound`)

#Create New Column for 1 and 0s
data$Category <-as.factor(data$Category)

# Run regression
model <- lm(`Influence Score` ~ `Avg Compound` + Category, data = data)

# View results
summary(model)

#predicted influence per category
library(ggplot2)

ggplot(data, aes(x = Category, y = `Influence Score`)) +
  geom_jitter(width = 0.2, alpha = 0.5) +
  geom_boxplot() +
  scale_y_continuous(
    limits = c(-1, 1),
  ) +
  labs(
    title = "Observed Influence by Content Category",
    x = "Content Category",
    y = "Influence Score (Zavg)"
  ) +
theme_minimal()# Use full dataset
data <-
Master_Document_Comments_Political_Activist_CSV_FILE_READY_Tiktok_Comment
#making all values in Avg Compound absolute value
data$`Avg Compound` <- abs(data$`Avg Compound`)
# Run regression
model <- lm(`Influence Score` ~ `Avg Compound`, data = data)
# View results
summary(model)
#predicted influence per category
library(ggplot2)
ggplot(data, aes(x = `Avg Compound`, y = `Influence Score`)) +
geom_jitter(width = 0.2, alpha = 0.5) +
geom_abline(method = "lm") +
labs(
title = "Observed influence due to Emotional Intensity \n (ENTER CATEGORY)",
x = "Emotional Intensity",
y = "Influence Score (Zavg)"
) +
theme_minimal()# Libraries
from vaderSentiment.vaderSentiment import SentimentIntensityAnalyzer
import gspread
from oauth2client.service_account import ServiceAccountCredentials
# 1) Connect to Google Sheets
SCOPES = [
"https://www.googleapis.com/auth/spreadsheets",
"https://www.googleapis.com/auth/drive.file",
"https://www.googleapis.com/auth/drive",
]
SERVICE_ACCOUNT_FILE = "Service_Acount.json"
creds = ServiceAccountCredentials.from_json_keyfile_name(SERVICE_ACCOUNT_FILE, SCOPES)
client = gspread.authorize(creds)
# Open your sheet
sheet = client.open("Master Document (Comments)").sheet1
# 2) Get text data from the "comments" column (column C = 3)
column_data = sheet.col_values(3)[1:] # skip header row
# 3) Initialize VADER
analyzer = SentimentIntensityAnalyzer()
results = []
# 4) Analyze each comment
for sentence in column_data:
if sentence.strip() == "":
results.append({"compound": "", "pos": "", "neu": "", "neg": ""})
continue
score = analyzer.polarity_scores(sentence)
results.append(
{
"compound": score["compound"],
"pos": score["pos"],
"neu": score["neu"],
"neg": score["neg"],
}
)
# 5) Prepare lists for batch update, so it doesn’t exceed google’s
# API limit. Store data from column into a list, then update the sheet
# in one run
compound_values = [[r["compound"]] for r in results]
pos_values = [[r["pos"]] for r in results]
neu_values = [[r["neu"]] for r in results]
neg_values = [[r["neg"]] for r in results]
# 6) Write entire columns at once
sheet.update(values=compound_values, range_name=f"D2:D{len(results) + 1}")
sheet.update(values=pos_values, range_name=f"E2:E{len(results) + 1}")
sheet.update(values=neu_values, range_name=f"F2:F{len(results) + 1}")
sheet.update(values=neg_values, range_name=f"G2:G{len(results) + 1}")
VADER to obtain emotional intensity metricDetails on Zeeschuimer Collection Process
For each hashtag, Zeeschuimer collects the first 30 recommended posts but only uses the first 15. For each post, it scrolls to gather approximately 15 sets of comments. A maximum of 20 comments per post is collected, though some posts have fewer. The total of 15 posts per hashtag is maintained, and some hashtags were replaced with more relevant ones.
For the collection of posts from hashtags and the For You Page, We used a fresh account. The Gmail account details are: Name: Test SHRO 2, Birthday: 1/1/2008, Gender: Rather not say. Cookies should be cleared. The timezone is recorded as Singapore Standard Time, with date and time 9/11/25, 12:20. The device model is Z370 AORUS Gaming 5 running Microsoft Windows 11 Pro, Firefox version 144.0.2, and Zeeschuimer edition v1.13.4.